Remember all maps can have a frame of reference added to them. The questions in the frame of reference are to cause students to think more indepth about the information found on the thinking map.
Color coding can help organize the information on a thinking map. It can also make the map easier to read and follow. Have your students color code their maps and see how in improves their understanding.
Introducing the Fat Bridge Map
The Bridge Map is often difficult for students to read. The Fat Bridge Map restates the relating factor which makes it easier to read. K-2 students or students just beginning to use this map often find the Fat Bridge Map much more "kid friendly." Let your students use both and see which one they prefer.
The Bridge Map is often difficult for students to read. The Fat Bridge Map restates the relating factor which makes it easier to read. K-2 students or students just beginning to use this map often find the Fat Bridge Map much more "kid friendly." Let your students use both and see which one they prefer.
| fat_bridge_map.docx |
| tm_sheet_with_summary.xlsx |
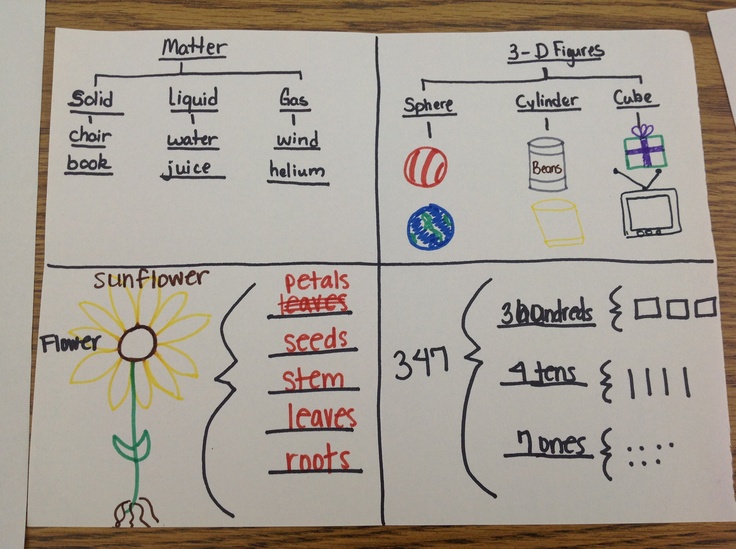
Using Thinking Maps with Math
Key Words for each thinking map
| key_words_in_math_for_thinking_handout.pdf |
Good examples of thinking maps created during math lessons
| k-12_math_1a.ppt |
| k-12_math_2.ppt |
pinterest resources
Click image to access pinterest resources
Click on thinking maps image to link to www.thinkingmaps.com

Click on image to link to www.thinkingmaps.org
